新着情報
年末年始休業のお知らせ
Dec 27, 2019
AIBeaconとは
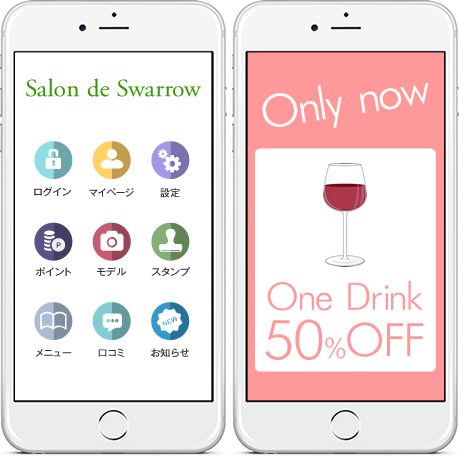
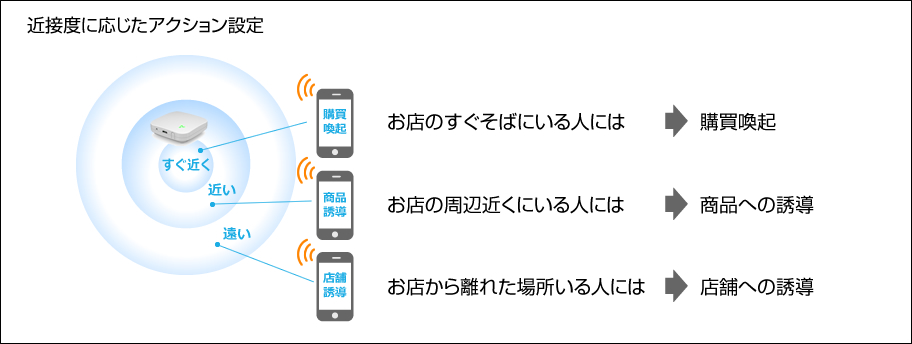
AIBeaconはスマートフォンの独自のデータマイニング技術を利用した、O2Oサービスです。各種商業施設やイベント会場などに設置したAIBeacon端末にユーザが近づくとそのユーザの行動特性を取得し、プッシュ通知やクーポンなどでユーザの特性に合った効果的なアプローチをタイムリーに仕掛けることを可能にする、まさに画期的なO2Oソリューションです。

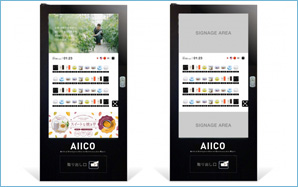
デジタルサイネージ連動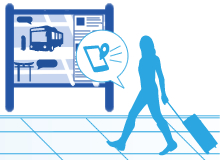
観光案内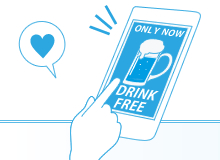
タイムリーな情報発信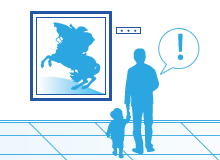
ミュージアム展示作品案内
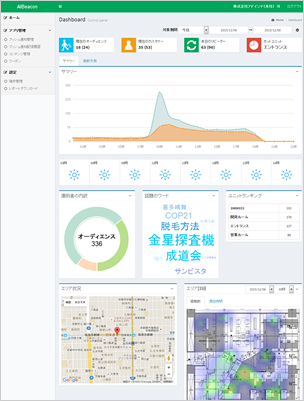
有益な分析を可能にする
様々な機能
AIBeacon端末を店舗、各種商業施設に設置するだけで施設近隣にいるスマートフォンユーザの行動特性を取得でき、付随する解析ツールを併用することで「いつ、どれくらい」の人がプレイスに接触しているかが分かります。
また、ユニークID計測により「リピート数・率」も解析可能です。
ユーザの特性を細かく分析できるのでより効果的なアプローチが期待できます。

従来、計測が難しかった
店舗フロア、売り場の分析が可能に!
販促効果が高い売り場に改善できます。
AIBeaconでは、独自のデータマイニング技術のため、スマートフォンユーザーのデータを広範囲に取得が可能で、カメラや人的カウントでカバーできなかった領域まで計測が可能になります。 まるでWEB画面で計測する感覚で、店舗のフロア、売り場を分析することが可能になります。
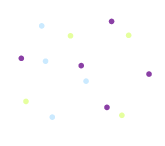 リアルタイム動態計測
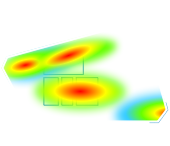 ヒートマップ動態計測
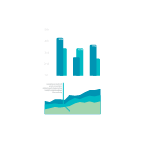 アプリ対応詳細レポート